
- Видео 91
- Просмотров 4 439 315
R Programming 101
Ирландия
Добавлен 31 окт 2018
This channel provides teaching videos on data analysis and statistical analysis using R programming. The teaching videos include subjects like data cleaning, data manipulation, data visualization, statistical analysis, and machine learning and AI (artificial intelligence).
Create fantastic tables using gtExtras in R.
Welcome to a closer look at the gtExtras package in R! 📊✨ In this video, we'll explore how to enhance your data tables with the powerful and flexible features provided by the gtExtras package. Whether you're a data analyst, data scientist, R programmer, or enthusiast, this package will help you take your data presentation to the next level. If you're learning R programming then this video is for you. In fact, even if you are a beginner, you'll find this helpful.
What You'll Learn:
Introduction to gtExtras: Understand what the gtExtras package is and how it complements the gt package for creating stunning tables in R.
Key Features: Discover the key features of gtExtras, including customized ...
What You'll Learn:
Introduction to gtExtras: Understand what the gtExtras package is and how it complements the gt package for creating stunning tables in R.
Key Features: Discover the key features of gtExtras, including customized ...
Просмотров: 2 317
Видео


Plotly for 3d and interactive plots in R
Просмотров 1,5 тыс.День назад
Use plotly to create interactive and 3d plots in R. Plotly integrates with ggplot2. If you're interested in data visualisation and want to create plots and graphs that tell a story with your data then plotly is a great place to start. This video is for anyone interested in R programming.
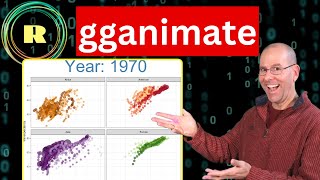
Animations in R with gganimate
Просмотров 3,1 тыс.14 дней назад
Create plots that are animated using ggplot2 and the gganimate packages in R. If you're learning data visualization using R programming then you'll love this tutorial. In this video Greg Martin will walk you through the code to create colourful plots and graphs that move and change. These can be scatterplots bar charts, histograms, line graphs and more. It works particularly well when looking a...

Multiple regression analysis - effect modifiers and interactions
Просмотров 1,7 тыс.2 месяца назад
This is a video about linear regression and how when undertaking multiple regression analysis, we need to take into account the possibility of variables that interact and effect modifiers. Interaction and effect modifiers are important to understand when you are dealing with multiple variables in a complex dataset. This video walks you through the R programming skills you need to generate meani...

Multiple regression - making sure that your assumptions are met
Просмотров 1,9 тыс.2 месяца назад
Doing diagnostics on your model assumptions in R programming is easy. This video is about linear regression, specifically multiple regression and making sure that the assumptions of your model are met.
Multiple regression. How to deal with Outliers and Colliniarity
Просмотров 2,9 тыс.3 месяца назад
When doing linear regression or multiple regression, your data may have outliers. Outliers are data points where the residual values are far from the model. In this video we explore how to identify outliers and discuss what to do when they are found. Colliniarity or multicolliniarity occurs when two or more of the explanatory variables are correlated. There are times when these variables should...

Simple Linear Regression.
Просмотров 4,2 тыс.4 месяца назад
This is the fist in a series of videos that focus on Multiple Regression. Our starting point is to understand simple regression before building upon that understanding. Regression analysis considers the relationship between an explanatory variable and an outcome variable and allows us to understand how much of the outcome variable can be explained by the explanatory (or independent) variables. ...
Multiple regression: how to select variables for your model
Просмотров 6 тыс.4 месяца назад
When doing linear regression, it is important to include right right variables in your model. Multiple regression differs from simple linear regression in that more than one explanatory variable is used in the model. Master variable selection in multiple regression with our concise guide! Dive into the art and science of choosing the right predictors for your statistical models. This video is p...

Adding variables to your multiple regression model
Просмотров 3,5 тыс.4 месяца назад
Linear regression is considered to be simple regression if only one explanatory variable is used and multiple regression if the model includes more than one explanatory or independent variable. In this video we explore how to add additional categorical variables and numeric variable to your linear regression model. If you are interested in statistical analysis then learning how to undertake a m...
Multiple Regression from beginning to end in 30 minutes.
Просмотров 11 тыс.6 месяцев назад
Multiple regression is linear regression analysis using more than one explanatory variable. Regression analysis involves creating a model that can be used to predict the value of an outcome variable from an independent variable. This video uses R programming to to illustrate multiple regression and the diagnostics required to ensure that the assumptions are met. These include that the residual ...
Quarto - tips and tricks
Просмотров 4,6 тыс.6 месяцев назад
In this video about R programming Greg and Andrew (from Equitable Equations - see link below) talk through some tips and tricks when it comes to using Quarto in R Studio. Quarto is similar to R markdown but much more user friends. It allows you to create a finished document (word, PDF or slides) inside the R studio environment. So if you are into data analysis, data science, statistics or resea...
Lubridate - how to manipulate date and time data in R
Просмотров 10 тыс.9 месяцев назад
If you're learning R programming and want to manipulate data and time data then the lubridate package is going to rock your world. Its part of the tidyverse collecation of package and so integrates nicely with other tidyverse packages like ggplot2 and dplyr. Lubridate lets you parse strings into date and time objects, extract components of dates and times and even work with timeframes like dura...
Quarto - replacing R Markdown in R Studio.
Просмотров 23 тыс.9 месяцев назад
Quarto - replacing R Markdown in R Studio.
Using R programming to manage categorial variables or factors using the forcats package
Просмотров 8 тыс.Год назад
Using R programming to manage categorial variables or factors using the forcats package
Ggplot Colors - how to use colors effectively when creating plots with ggplot2
Просмотров 7 тыс.Год назад
Ggplot Colors - how to use colors effectively when creating plots with ggplot2
Advanced ggplot #2 - create beautiful plots and graphs using R programming.
Просмотров 13 тыс.Год назад
Advanced ggplot #2 - create beautiful plots and graphs using R programming.
R programming for beginners: Select, filter and fill functions within the tidyverse
Просмотров 6 тыс.Год назад
R programming for beginners: Select, filter and fill functions within the tidyverse
Separate and Unite - manipulate your data with R programming
Просмотров 10 тыс.Год назад
Separate and Unite - manipulate your data with R programming
Group by and Summarise functions in R programming - use the tidyverse package to wrangle your data
Просмотров 28 тыс.Год назад
Group by and Summarise functions in R programming - use the tidyverse package to wrangle your data
Encircled observations - use ggplot and ggalt to create great plots and data visualization.
Просмотров 3,3 тыс.Год назад
Encircled observations - use ggplot and ggalt to create great plots and data visualization.
Thank you Greg. This video is a life saver. My last masters unit (From Fiji) required to use R Programming Language for the major assessment. I had never used R and coming from a non programming background i struggled in keeping up labs, this crash course truly helped. So many vital topics put in so amazingly, well knitted. I learnt more in this video then i had in my whole semester. Thank you and best wishes
It would be great to see all the frames. It’s big and unclear
Can’t see all in the console
Sir kindly do a tutorial on trend analysis like Mann-Kendal and WAVK Test
I loved the video but still need help with ggplot as my data seems not to be responding. I am leaving the command and the feedback here if someone can help me. > ggplot(data = modelling_data,x=Time_minutes,y=rLH)+geom_point()+geom_line() Error in `geom_point()`: ! Problem while setting up geom. ℹ Error occurred in the 1st layer. Caused by error in `compute_geom_1()`: ! `geom_point()` requires the following missing aesthetics: x and y. Run `rlang::last_trace()` to see where the error occurred.
Is there R for macs?
I have a conflict with %>%. How can I get rid of it?. Great video, perfect structure. Thanks a lot.
the explanation in regrads to the equal signs threw ,e a bit off, ususally "=" means youa ssing a value, since you want to filter an assignment would be pointless hence you want to access the assigned value of said variable which you do with "==" but the logic in regards the what to do comes from the filter function, so attributing the "if" to the "==" may be not 100% correct as the actualy filtering happens through said function, you simply check the value with the "==" and decide according to the defined logic.
Just started learning R, I love how you simplify things to make them make sense. Thank you
wow thanku man!
Hi, Dr Greg. So far, I've watched 5 videos about ggplot. I wanna confess that they are amazing and am sure that I'll watch all of the rest soon. Thanks for your nice explanation. Honestly, I lose track of time while watching your videos.
Awesome yet again 🎉 Greg , my R superhero 😎
Is it possible to add additional variables to the hover tooltip that are not part of the plot's aes()? For example, in the starwars plot, I would like to hover and see the name and species of the point of interest. Great video as always!
Thank you for this video! Can you please do one on how to make pie charts? I have been doing a lot of digging for good videos on them, but I haven't had any luck:(
That's because a good statistician would never use pie charts 😉
Your video is very informative, but the sound effects are distracting and really creeping me out. I could not even finish the video and wanted to write this comment.
'Don't do drugs, Do your best, Boom shakalaka'-Greg Martin
Excellent content and very timely! I looked for something like this just yesterday! I’ll try it now🥰 We plot charts but the precise values are often found only in the text, which I found inconvenient as we need to either remember or add the values manually to a presentation slide. It is nice to have a summary with values visually 🎉
I got an error after trying the iris summary table: Error in loadNamespace(x) : there is no package called ‘svglite’. I could get it to work after installing the package 'svglite'. Thanks for your introduction, Greg!
This is fucking awesome!😂
Excellent lesson. Is it possible to have a common x-axis? For instance, by centering?
I think those distributions do have a common x-axis, they just represent different values on it (you can see that from the different mean and median values)
😮--- literally me whilst watching this video. THANKS!!
Me too!😮
Cool
👏👏
🎉😮😮
babynames & gapminder datasets missing in R
Great introduction to R Greg, thanks for that. Quick question though. After selecting the columns, so name and age in the video? How can I filter on an exact match that is text not numerical?
we would like to know more about these kinds of graphs and pattern for advanced analysis .i love it
Wow❤
Greg, It would be great if you could take a stab at echarts4r. It is an interactively package like plotly but as far as I can tell more powerful and somewhat easier to understand. Some of the plots I have seen made by it simply blow my mind. Just a thought.
Mahn u teach so fast I gotta slow it down
Nice presentation. Although I am not a big fan of plotly which I find cumbersome and convoluted compared to ggplot2. Neither am I a fan of 3D plots in general. I find them to be misleading and better to use 2D with other type of coding (color, size etc) or faceting for the 3rd dimension. Thanks.
Fair enough! good points... :)
nimic n am inteles sa mi bag pl
I used plotly to visualise results from a latent profile analysis on personality scales (similar to your interactive eye colour visual) - wondering now what else I could do with plotly on those results ... ? Thanks for this, love your tutorials!
Looking forward to seeing what else you might do!! Thanks for the feedback.
Thanks a lot Greg. I love your videos and reels. Can you exlpain bit about Logistic regression?
Sure thing! - Will make some videos about that soon
Marvelous as usual 🎉. Awesome. Thank you
Thanks for the feedback :)
I have zero knowledge on programming, so it is not easy-pizzy for me. What to start with? I need only to create damp plots that is it
Watch his past videos; they build a solid foundation for these current tutorials. I assure you, he is one of the best, if not the best, R tutors out there.
Thanks for that comment @NattyGism... Yes, @maximzhentichka360 - please do go to my channel and start at the beginning. Hopefully you'll get the help you need. www.youtube.com/@rprogramming101
It's great 💯👍
Yes - I agree, plotly is great
I watched it first 🎉 awesome video thank you!
Yay! Thank you!
the "bumshakalaka" caught me off guard hahhahahhahahhahahhahahhah Great video
thanks :)
Introduction to Periodic chemistry
Thank you so much for these amazing tutorials!🙏I have recently found your channel and they are EXTREMELY helpful. They are helping me a lot in my data analysis in my PhD. If possible, could you kindly make a tutorial video on how to use RSA R package to do polynomial regression and response surface analysis to test congruence/incongruence (Edwards 2002). Thank you and please keep making these amazing tutorials!🙏🙂
Hi Greg, I am new to R and the whole world of programming. I found your first video very educative, but where do I go from here? I thought you had a numbered series of videos that would teach how me the complete language. I visited your page, and there are so many videos, I literally don't know which one to use. it is possible to do a series of videos from beginner to advanced use of R. thank you.
Very helpful! Thank you, sir!:D
Glad it was helpful!
Cool trucks. Explained in 5 mins! Great job, thanks.
Glad it was helpful!
Hello, could anyone help me? I've been trying this code, and instead of showing the animated plot in the Viewer pan, I get 100 png files saved in my working directory Would you know how to fix it?
I learned so much from your videos... Thank you for new lrearnings!...
Happy to hear that!
Wow this is lovely. I will use this today. Thanks Greg!
Such a wonderful way to introduce new concept and making it super easy to understand! Thanks much, Greg!😎
thanks
I had to say I did fall in love with r as I am getting in data analysis and it made me feel at ease
glad you love it!! :)
Thank you so much, you have made R easy to understand
You're very welcome!
Cada tanto R programming nos recuerda el inmenso potencial y uso de R, Gracias.